Extreme Weather Impacts the National Flood Insurance Program

Hurricanes and floods are nothing new in the United States.  In the last decade, however, this country has seen a significant increase in these types of extreme weather events.  In response to the financial strain they have put on the National Flood Insurance Program (NFIP), Congress passed the Biggert-Waters Insurance Reform Act of 2012 (BW-12).

The NFIP, operated by the Federal Emergency Management Agency (FEMA), offers insurance for individual businesses and homeowners in flood prone areas. Congress created this program in 1968 in response to the financial chaos caused by Hurricane Betsy in 1965. This storm, which devastated the Gulf Coast, was the first billion-dollar natural disaster in U.S. history.

To calculate flood risk and the corresponding insurance rates for properties, the NFIP uses special maps that indicate flood zones.  Many of these flood insurance rate maps, however, have not been updated in decades and do not reflect the current flood risk associated with our changing environment.  As a result, many policyholders have been paying below market rates.

The Biggert-Waters Insurance Reform Act re-authorizes the NFIP for five years, but requires a number of changes.  These include, the gradual phasing out of subsidized policies and moving the program toward risk-based rates as new flood insurance rate maps become available.  Subsidized policyholders will see a rate increase of 25% per year until their premiums reflect the actual risk of their location. Non-primary residences, non-residential properties, and repetitive loss properties will be among the first to see these changes.

BW-12 was signed into law a few months before Super-storm Sandy devastated coastal communities throughout the northeast.  Many people whose homes were damaged or destroyed by Sandy’s record storm surge are now beginning to feel the effects of this new policy.

NYC Updates Hurricane Evacuation Zones

Super-storm Sandy devastated New York City last autumn.  In its wake, emergency management officials have re-drawn the city’s hurricane evacuation zones.

The new zones are based on improved data from SLOSH (sea, lake, and overland surges from Hurricanes), a national Weather Service computer model designed to estimate storm surges.  This new system takes the width of a storm and its wind field into account whereas the old zones were primarily based on a hurricane’s Saffir-Simpson category.

NYC’s new zones are labeled 1 through 6, with zone 1 being the first to be evacuated in the event of a storm.  This system is numeric to avoid confusion with FEMA’s flood zone maps used for insurance purposes.

Go to nyc.gov/hurricane to see if you live or work in an evacuation zone.

NYC's new hurricane evacuation zones.

NYC’s new hurricane evacuation zones.

Image Credit: nyc.gov

Drought Update: Summer 2013

This summer has been marked by heavy rain and even flooding in many parts of the United States.  Long-term drought, however, continues to plague a large section of this country.

According to the latest report from the U.S. Drought Monitor, 45% of this nation is in some form of drought. While this number represents improvement for some areas, such as the east and mid-west, the western states remain dry. Conditions of moderate drought or worse cover 77% of that region with 19% suffering under extreme drought.  These numbers are up from this time last year.

As the drought intensifies in the west, it is helping to fuel the region’s numerous wildfires.

droughtImage Credit: U.S. Drought Monitor

Climate Reality Leadership Corps

Someone once said, the only constant in nature is change.  This is very true; Earth’s climate has changed a number of times in its nearly five billion-year history.  The change happening now, however, is occurring faster than it has before.  The overwhelming majority of experts agree that modern climate change is rooted in human activities that emit massive amounts of heat trapping green house gases into the atmosphere.

One group working to address the perception gap that exists between scientists and the general public on this pressing issue is the Climate Reality Project. This non-profit organization educates and trains concerned citizens to be climate leaders – volunteers who share the facts about climate change and its diverse impacts with their local communities. Last week, I was invited to participate in their training conference in Chicago, IL.  Selected through an application process, I was one of 1,500 attendees representing all 50 states and more than 70 countries.

This three-day event was packed with presentations and breakout sessions that ranged from science to best practices for communication.  The headline speaker, however, was Noble Laureate Al Gore.  Knowledgeable and extremely generous with his time, the former vice-president spent the entire second day with us.  He delivered the most recent version of his now famous Inconvenient Truth slideshow and then broke it down slide by slide, explaining the history and science behind each image and chart.  While the subject of climate change has become politically charged in recent years, this event was not about propaganda.  It was about the science – the reality – of our changing climate.  As such, two of the world’s most prominent climate scientists, Dr. Michael McCracken and Dr. Henry Pollack, were on hand to clarify facts and answer questions.

As a self-educated weather and climate blogger, I was excited to learn about the newest developments in climate science from leading experts. In the past, most scientists said climate change only increased the odds for extreme weather events, but could not say it was solely responsible for any one storm. Now, according to the National Center for Atmospheric Research, “Global warming is contributing to an increased incidence of extreme weather because the environment in which all storms form has changed from human activities.”

These extreme weather events have a wide range of impacts.  From mega-storms and floods to heat waves and drought, they each take a toll on our economy and public health. As a human generated issue, only humans can change climate change and the first step is acknowledging the problem.

The Climate Reality Project's Green Ring is a symbol of commitment to spread the reality about climate change.

The Climate Reality Project’s “green ring” is a symbol of commitment to spread the facts about climate change.

Image Credit: CRP

NYC Monthly Summary: July 2013

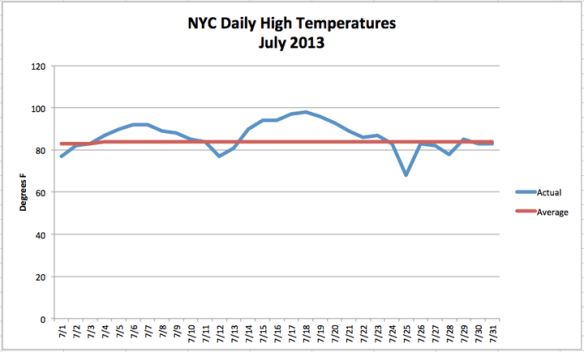
July is usually the hottest month on the calendar for New York City, and this year temperatures soared. We had two separate heat waves and a total of ten days reaching 90°F or higher.  The second heat wave of the month was a lengthy event.  Lasting seven days, it was the city’s longest heat wave in eleven years. This extreme heat brought the city’s average monthly temperature up to 79.8°F. That is 3.8°F above normal.

While searing temperatures dominated the month, the city also experienced a few cooler than average days this July.  In fact, July 25th set a new daily record for the coldest high temperature in Central Park with a peak reading of only 68°F.

In terms of precipitation, NYC was mostly dry.  We received 2.84 inches of rain, which is 1.76 inches below normal.  This was a significant departure from last month’s near record rainfall.

July_TempsGraph Credit: The Weather Gamut